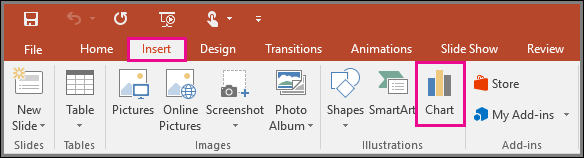
To create a simple chart from scratch in PowerPoint, click Insert > Chart and pick the chart you want.
-
Click Insert > Chart.
-
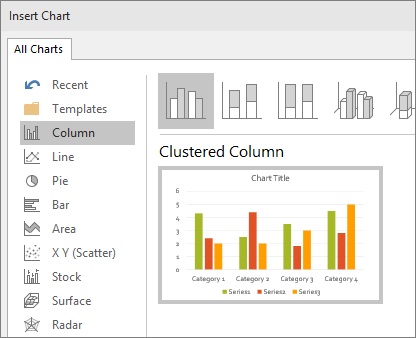
Click the chart type and then double-click the chart you want.
-
In the worksheet that appears, replace the placeholder data with your own information.

-
When you’ve finished, close the worksheet.
Source: Microsoft